Unlock Different Security Perspectives with Kusto Graph Functions
Last week I noticed the post of John Lambert about a new Kusto operator lift and thought this is something that needs further investigation. The lift operator takes a tabular structure as input and “lifts” the data into a graph for a visual representation. We all know that visualizing data in Graphs is beneficial, as it can give other perspectives to the data and by doing so, allow you to identify new things. Within security, we deal with huge volumes of data, thus adding graph views to detection, hunting and response capabilities is a welcome change. With these new Kusto funtions you do not have to write 100s of lines to perform make-graph operations, you simply map what you want in a json and the functions do the job for you.
Full Post & Thread 🧵: https://x.com/JohnLaTwC/status/2038719990766170509
This blog describes how to get started with the newly introduced functions and shares two examples. Graphs are not a new concept in Kusto, previous presentations and blogs of others explain the core of this functionality.
- Workshop: Kusto Graph Semantics Explained - Fabian Bader
- Attack Path Discovery in Kusto - Olaf Hartong
- Detect Lateral Movement with KQL Graph ☕ Attack Paths & Security Insights - Fabian Bader
Getting started with Graphs
The GitHub Gist posted by Diana Damenova is the starting point for using the new operators. It outlines what you need to do in order to make it work and it shows a couple of examples. Diana is sharing more examples based on the KC7 dataset on her X account. With the KC7 dataset you do not have to use your own data to get started.
🔗 - https://gist.github.com/ddamenova/43696f1e7c63c66f924637e9577316ee
Personal additions
A couple of personal notes that help to get started.
- Have an Azure Data Explorer Cluster. If you do not have one already, you can start with the 100GB free Azure Data Explorer Cluster.
- Install the functions
Lift_To_Graph,Graph_Render_ViewandGraph_Fold_By_Propertyin your ADX cluster. The Function Definitions are available in the gist. - Import or Push data to your ADX cluster (or use the KC7 data as starting point).
- Install the Kusto Explorer application - https://learn.microsoft.com/en-us/kusto/tools/kusto-explorer?view=microsoft-fabric.
- Connect Kust Explorer to your ADX cluster
- Time for Graphs! 📊
Use Case 1: Clustering Executables that Generate Alerts
Security alerts often tell you which process is suspicious, but not how that process is being used across your environment. In order to understand how the process is used across your environment, we first need to pull/collect the data. In this case, I am pulling the data from Unified XDR directly and export the results as CSV, which is done using the query below. This returns all the SHA256 hashes that have been part of an incident. From the hashes we pivot to the DeviceProcessEvents to collect all the child processes they executed.
let TimeFrame = 30d;
let AlertHashes = AlertEvidence
| where TimeGenerated > ago(TimeFrame)
| where EntityType in~ ('Process', 'File')
| distinct SHA256;
DeviceProcessEvents
| where InitiatingProcessSHA256 in~ (AlertHashes)
| project TimeGenerated, FileName, ProcessCommandLine, InitiatingProcessCommandLine, SHA256, InitiatingProcessSHA256, InitiatingProcessFileName
The CSV export must be ingested into the ADX Cluster to Graph the results. Once the data is ingested, the query below can be leveraged to generate the Graphs.
let logs = database('Demo').AlertData; //DatabaseName: Demo, TableName: AlertData
let proc_mapping = todynamic(```
{
  "node_types": [
    {
      "type":    "InitiatingProcess",
      "id":      "InitProc",
      "key":     "InitiatingProcessFileName",
      "props":   [
        "InitiatingProcessFileName",
        "InitiatingProcessCommandLine",
        "InitiatingProcessSHA256"
      ],
      "defaults": {},
      "defIcon": ""
    },
    {
      "type":    "ProcessCmdLine",
      "id":      "CmdLine",
      "key":     "ProcessCommandLine",
      "props":   [
        "ProcessCommandLine",
        "FileName",
        "SHA256"
      ],
      "defaults": {},
      "defIcon": ""
    }
  ],
  "edges": [
    {
      "type":   "Starts",
      "source": { "id": "InitProc", "type": "InitiatingProcess" },
      "target": { "id": "CmdLine",  "type": "ProcessCmdLine" },
      "props":  [
        "InitiatingProcessFileName",
        "InitiatingProcessCommandLine",
        "ProcessCommandLine",
        "FileName",
        "InitiatingProcessSHA256",
        "SHA256"
      ]
    }
  ]
}
```);
logs
| invoke Lift_To_Graph(proc_mapping)
| invoke Graph_Render_View()
An example of how to ingest CSVs into ADX is shared in the blog Incident Response Part 2: What about the other logs?
By lifting DeviceProcessEvents into a graph where each initiating process filename points to the child’s ProcessCommandLine, you see exactly what that binary actually launches. The data is loaded with common executables you would find in alerts, e.g., powershell.exe, cmd.exe, rundll32.exe. Based on a small dataset, the clusters below are formed, showing common windows utilities.
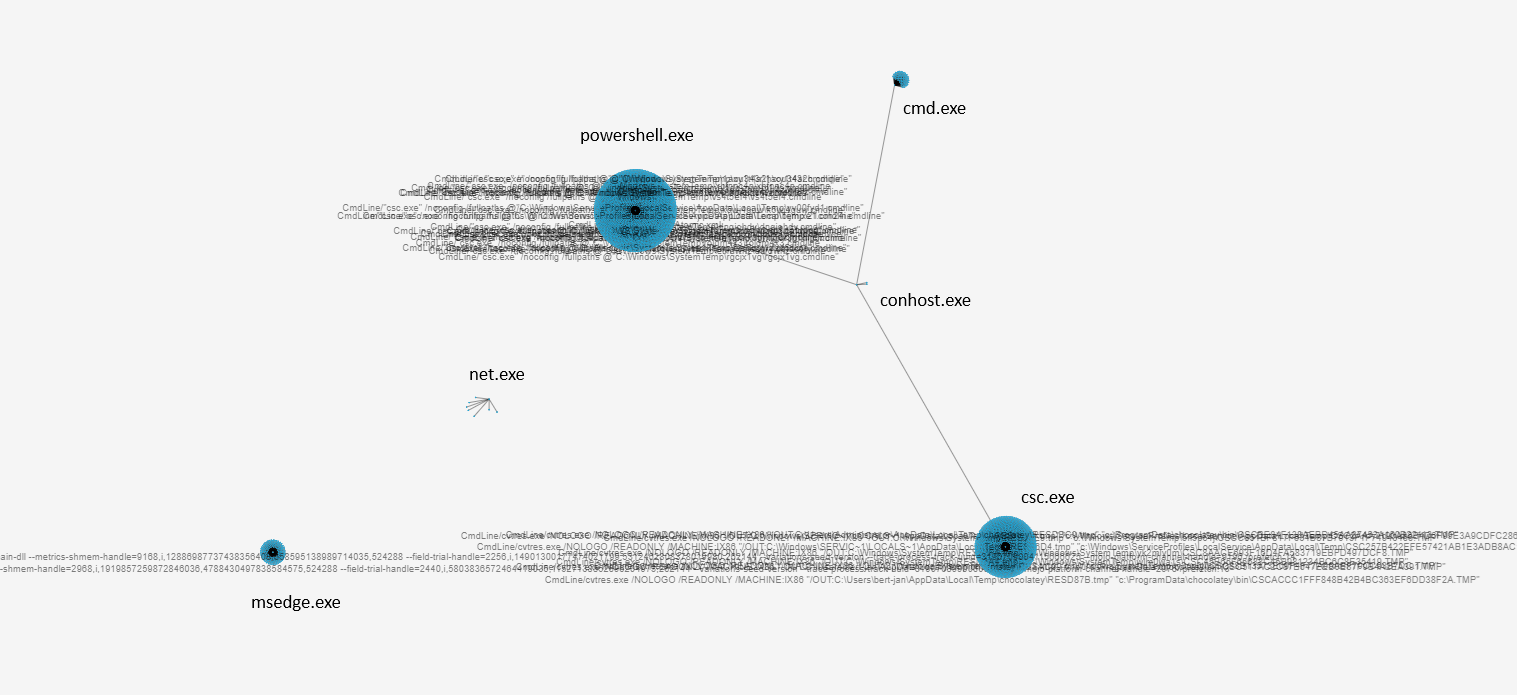
From these clusters, we can dive into the relations between the InitiatingProcessFileName and the child’s ProcessCommandLine. An example is shown below where the unique commandlines are having a relation with the net.exe utility.
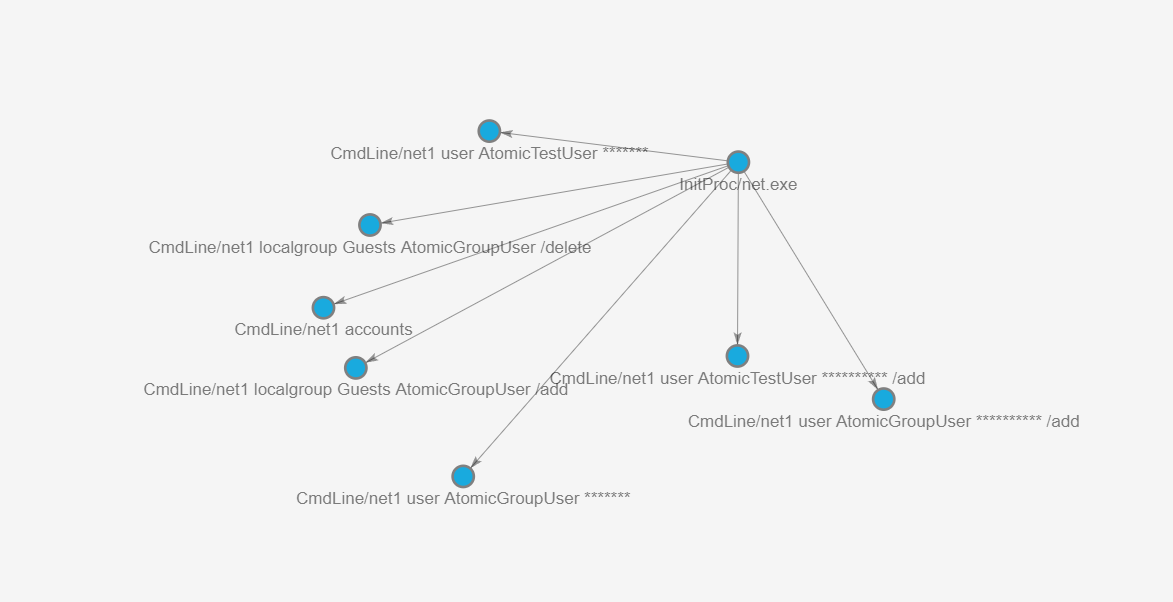
This reveals abused utilities (e.g., powershell.exe, cmd.exe, rundll32.exe) and uncommon command lines that stand out as lateral movement, persistence, or data exfiltration. It also clusters repeated malicious techniques: many different alerts can converge on the same “weird” command line pattern in the graph, making campaign‑level behaviour obvious.
In practice, this turns a flat process list into an interactive attack map, helping defenders move from isolated alerts to understanding the attacker’s toolchain and kill chain.
Use Case 2: Monitoring Service Principals for Anomalies
The second use case focuses on ServicePrincipals, as these logs are often difficult to grasp in tabular format. This is because the logs often contain huge volumes of sign-in activities from different sources. The first step is to obtain the relevant logs from the AADServicePrincipalSignInLogs table, simular logs can be obtained from the data in the EntraIdSpnSignInEvents table.
Obtaining ServicePrincipal logs:
AADServicePrincipalSignInLogs
| distinct ServicePrincipalId, ServicePrincipalName, ClientCredentialType, AutonomousSystemNumber, Location, IPAddress, AppId, ResourceDisplayName, UserAgent, ResultType
Identifying User Agents and ASNs Used by SPNs
Once the logs are ingested, in my case to the SPNs table in Azure Data Explorer the fun can begin. First I wanted to understand how SPNs are used within the tenant by mapping UserAgent → Location → ASN → SPN. This returns the graph as shown in the image below. On the left side of the image you find a cluster of ASNs. On the right side you can identify rarer UserAgent, Location, and ASN relations.
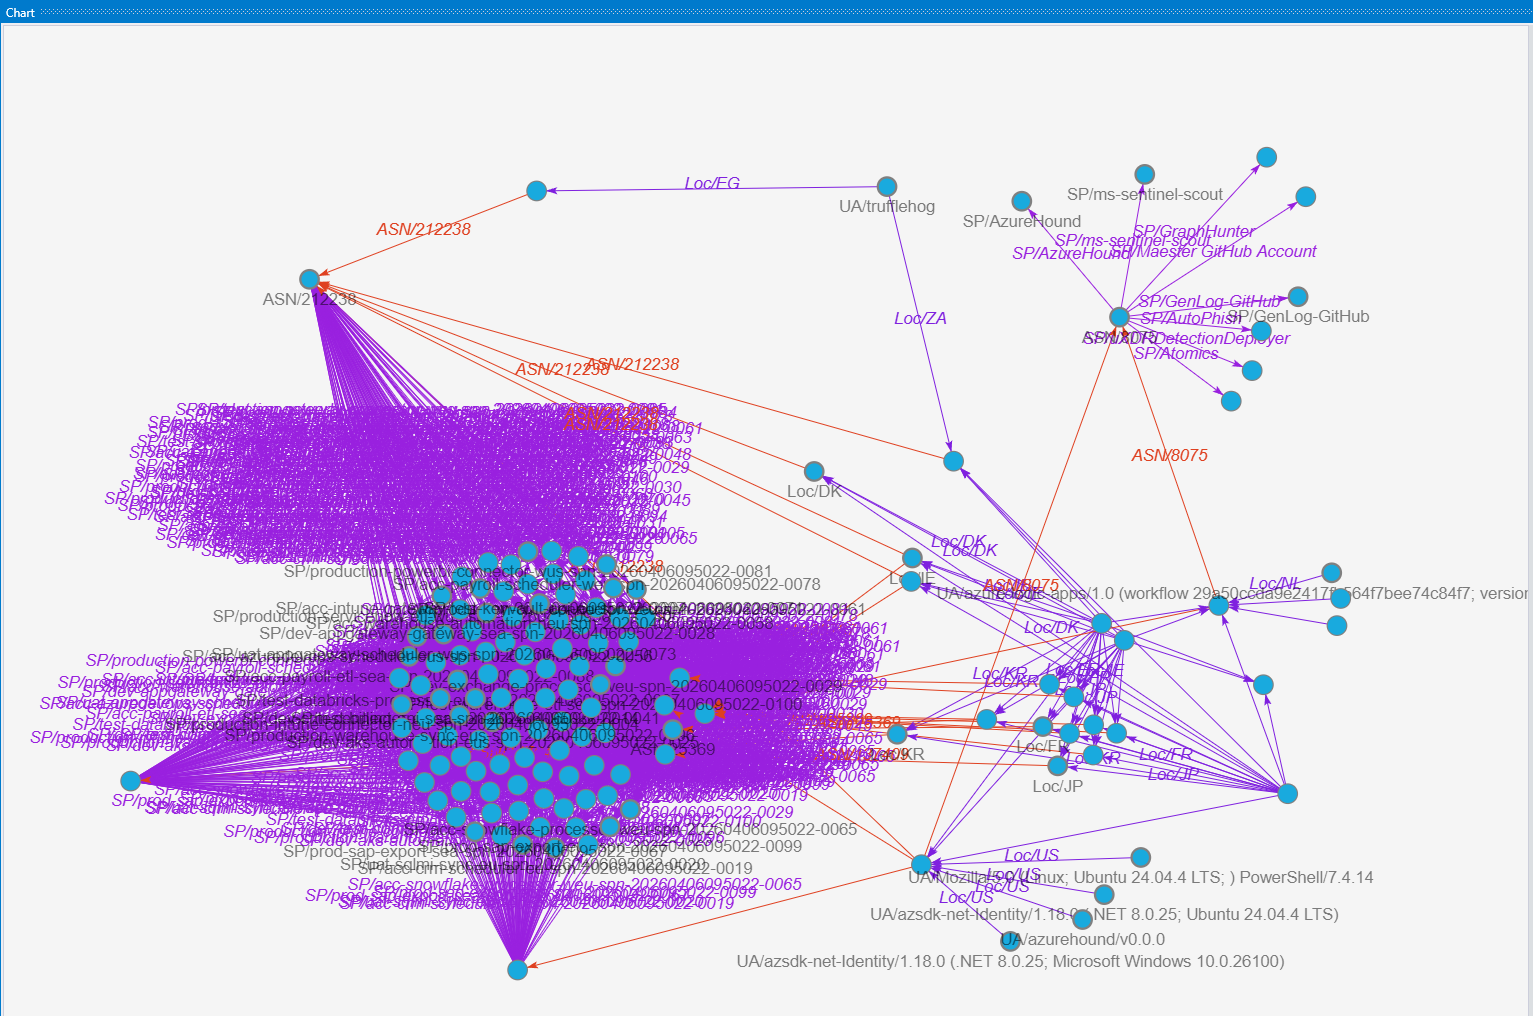
From the data we had we can further zoom into the specifics we want to highlight. In this case, the trufflehog useragent is a point of interest. Trufflehog is an open source tool to find, verify, and analyze leaked credentials. If the default configuration of Trufflehog is used the verification of found credentials is done using the default trufflehog useragent from which trufflehog tries to validate the credentials against the Graph API. In the graph below we can identify that a sign-in with the trufflehog useragent was done from Egypt and South Africa. Using the information obtained from the previous graph we can conclude that there have only been sign-ins from these countries with the trufflehog useragent, making it suspicious.
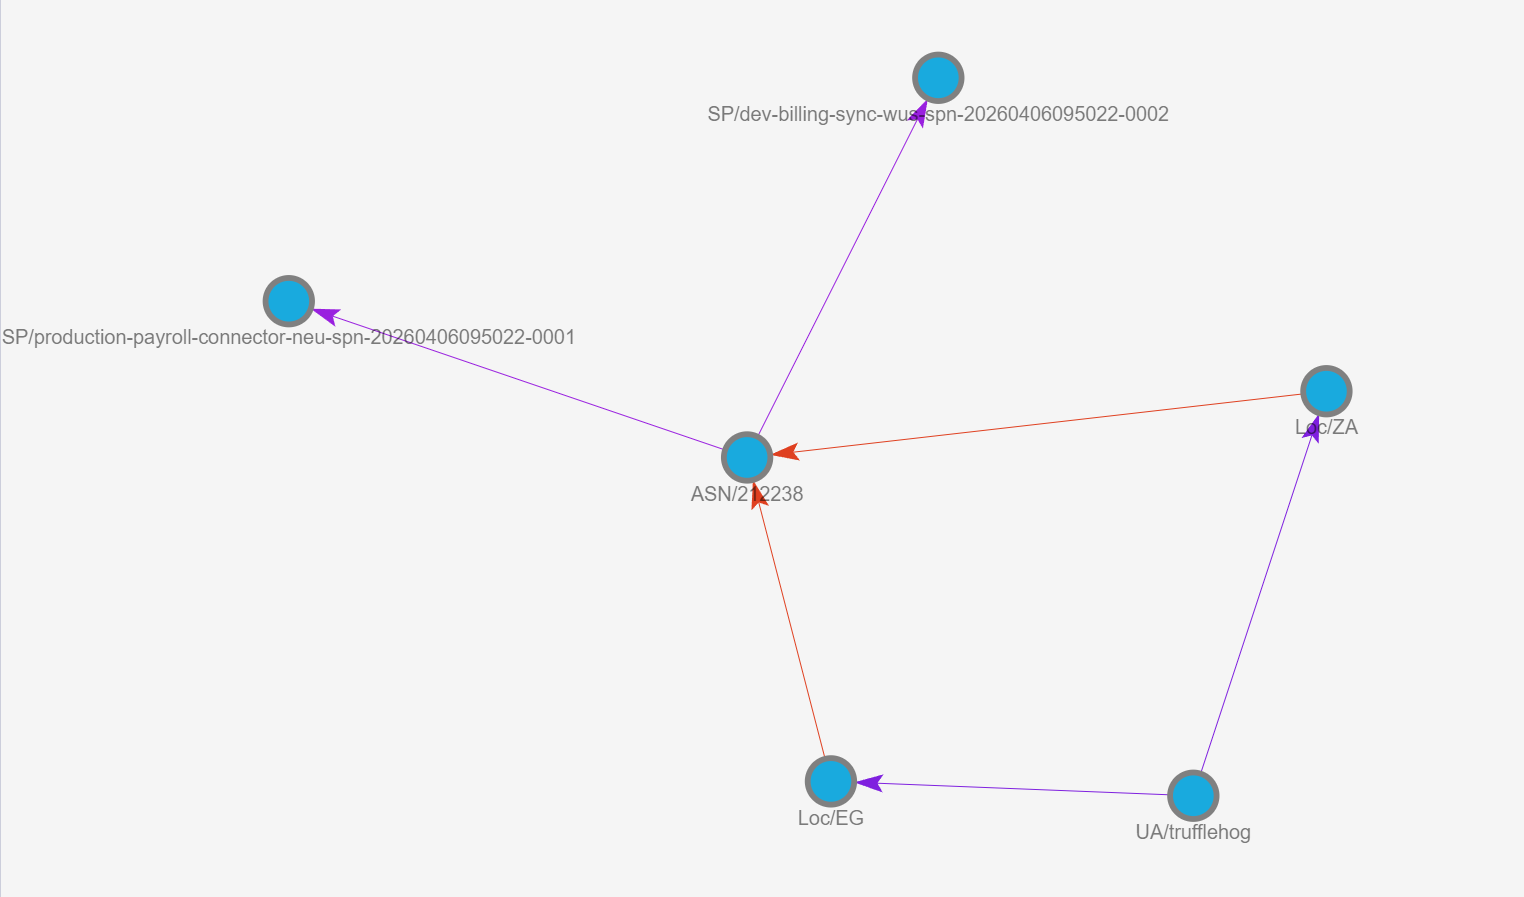
Graph UserAgent → Location → ASN → SPN:
let logs = database('Demo').SPNs;
let sp_chain =
    SPNs
    | distinct
        ServicePrincipalId,
        ServicePrincipalName,
        AutonomousSystemNumber,
        Location,
        UserAgent,
        IPAddress,
        ResultType;
let SPN_Mapping = todynamic(```
{
  "node_types": [
    {
      "type":    "UserAgent",
      "id":      "UA",
      "key":     "UserAgent",
      "props":   ["UserAgent"],
      "defaults": {},
      "defIcon": "https://raw.githubusercontent.com/benc-uk/icon-collection/master/azure-icons/Monitor.svg"
    },
    {
      "type":    "Location",
      "id":      "Loc",
      "key":     "Location",
      "props":   ["Location", "IPAddress"],
      "defaults": {},
      "defIcon": "https://raw.githubusercontent.com/benc-uk/icon-collection/master/azure-icons/Location.svg"
    },
    {
      "type":    "ASN",
      "id":      "ASN",
      "key":     "AutonomousSystemNumber",
      "props":   ["AutonomousSystemNumber"],
      "defaults": {},
      "defIcon": "https://raw.githubusercontent.com/benc-uk/icon-collection/master/azure-icons/Virtual-Network.svg"
    },
    {
      "type":    "ServicePrincipal",
      "id":      "SP",
      "key":     "ServicePrincipalName",
      "props":   ["ServicePrincipalId", "ServicePrincipalName", "ResultType"],
      "defaults": {},
      "defIcon": "https://raw.githubusercontent.com/benc-uk/icon-collection/master/azure-icons/Users.svg"
    }
  ],
  "edges": [
    {
      "type":   "UA_To_Location",
      "source": { "id": "UA",  "type": "UserAgent" },
      "target": { "id": "Loc", "type": "Location" },
      "props":  ["IPAddress"]
    },
    {
      "type":   "Location_To_ASN",
      "source": { "id": "Loc", "type": "Location" },
      "target": { "id": "ASN", "type": "ASN" },
      "props":  ["IPAddress"]
    },
    {
      "type":   "ASN_To_SP",
      "source": { "id": "ASN", "type": "ASN" },
      "target": { "id": "SP",  "type": "ServicePrincipal" },
      "props":  ["ResultType"]
    }
  ]
}
```);
sp_chain
| invoke Lift_To_Graph(SPN_Mapping)
| invoke Graph_Render_View()
Analyzing Credential Types and SPN Usage
In the next use cas,e we continue with the SPN data. We enrich the data with the credential type that is used, we find 3 distinct values in our data, none, clientSecret and clientAssertion. These are identified in the graph with the 3 big clusters on top. In this case the mapping is done slightly differently compared to the previous example, the graph flows from UserAgent → Location → ASN → SPN → Credential Type. The blue edge (SP_Used_Cred) highlights that some SPNs only use one credential type to authenticate, while others use multiple. This graph is useful to identify which credential types are used from where.
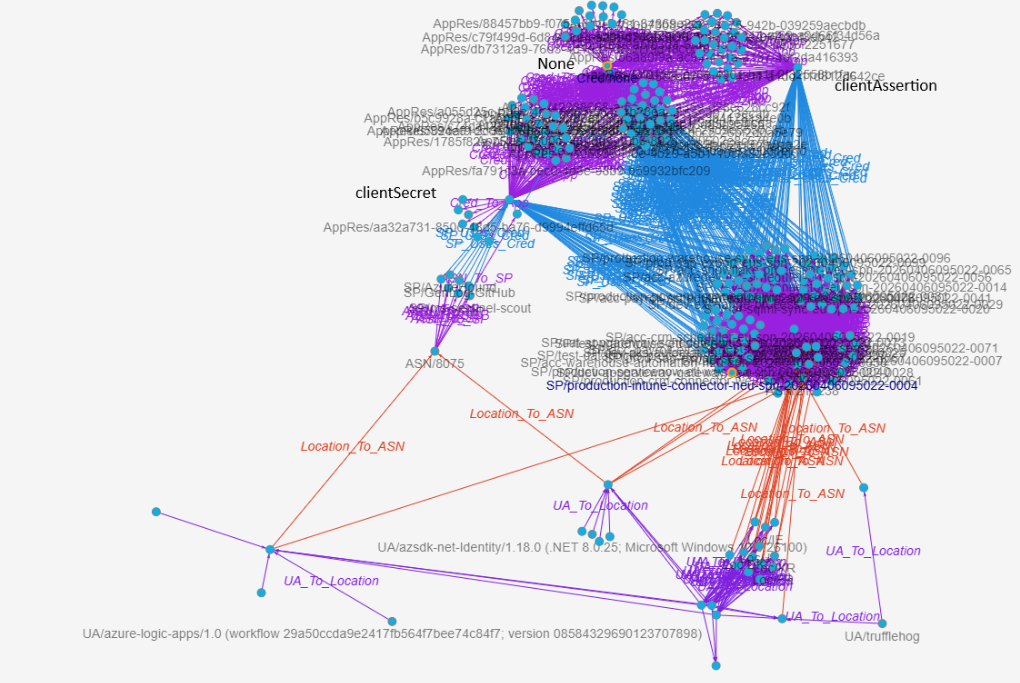
Graph UserAgent → Location → ASN → SPN → Credential Type:
let logs = database('Demo').SPNs;
let sp_activities =
    SPNs
    | distinct
        ServicePrincipalId,
        ServicePrincipalName,
        ClientCredentialType,
        AutonomousSystemNumber,
        Location,
        IPAddress,
        AppId,
        ResourceDisplayName,
        UserAgent,
        ResultType;
let SPN_Mapping = todynamic(```
{
  "node_types": [
    {
      "type":    "UserAgent",
      "id":      "UA",
      "key":     "UserAgent",
      "props":   [ "UserAgent" ],
      "defaults": {},
      "defIcon": "https://raw.githubusercontent.com/benc-uk/icon-collection/master/azure-icons/Monitor.svg"
    },
    {
      "type":    "Location",
      "id":      "Loc",
      "key":     "Location",
      "props":   [ "Location", "IPAddress" ],
      "defaults": {},
      "defIcon": "https://raw.githubusercontent.com/benc-uk/icon-collection/master/azure-icons/Location.svg"
    },
    {
      "type":    "ASN",
      "id":      "ASN",
      "key":     "AutonomousSystemNumber",
      "props":   [ "AutonomousSystemNumber" ],
      "defaults": {},
      "defIcon": "https://raw.githubusercontent.com/benc-uk/icon-collection/master/azure-icons/Virtual-Network.svg"
    },
    {
      "type":    "ServicePrincipal",
      "id":      "SP",
      "key":     "ServicePrincipalName",
      "props":   [ "ServicePrincipalId", "ServicePrincipalName", "ResultType" ],
      "defaults": {},
      "defIcon": "https://raw.githubusercontent.com/benc-uk/icon-collection/master/azure-icons/Active-Directory.svg"
    },
    {
      "type":    "CredentialType",
      "id":      "Cred",
      "key":     "ClientCredentialType",
      "props":   [ "ClientCredentialType" ],
      "defaults": {},
      "defIcon": "https://raw.githubusercontent.com/benc-uk/icon-collection/master/azure-icons/Key-Vaults.svg"
    },
    {
      "type":    "AppResource",
      "id":      "AppRes",
      "key":     "AppId",
      "props":   [ "AppId", "ResourceDisplayName", "ResultType" ],
      "defaults": {},
      "defIcon": "https://raw.githubusercontent.com/benc-uk/icon-collection/master/azure-icons/App-Services.svg"
    }
  ],
  "edges": [
    {
      "type":   "UA_To_Location",
      "source": { "id": "UA",  "type": "UserAgent" },
      "target": { "id": "Loc", "type": "Location" },
      "props":  [ "IPAddress" ]
    },
    {
      "type":   "Location_To_ASN",
      "source": { "id": "Loc", "type": "Location" },
      "target": { "id": "ASN", "type": "ASN" },
      "props":  [ "IPAddress" ]
    },
    {
      "type":   "ASN_To_SP",
      "source": { "id": "ASN", "type": "ASN" },
      "target": { "id": "SP",  "type": "ServicePrincipal" },
      "props":  [ "ResultType" ]
    },
    {
      "type":   "SP_Uses_Cred",
      "source": { "id": "SP",   "type": "ServicePrincipal" },
      "target": { "id": "Cred", "type": "CredentialType" },
      "props":  [ "ResultType" ]
    },
    {
      "type":   "Cred_To_App",
      "source": { "id": "Cred",   "type": "CredentialType" },
      "target": { "id": "AppRes", "type": "AppResource" },
      "props":  [ "ResultType" ]
    }
  ]
}
```);
sp_activities
| invoke Lift_To_Graph(SPN_Mapping)
| invoke Graph_Render_View()
Locating Anomalous Application & Resource Access
The last use case focuses on the target application and resource the SPNs connect to. This Graph turns your SPN activity into a graph that shows the full path from UserAgent → ASN → Service Principal → AppId → ResourceDisplayName. For security teams, this view quickly surfaces SPNs appearing from unexpected ASNs or tools, shared infrastructure driving multiple SPNs, and anomalous Apps or Resources accessed. This view would also be beneficial for Application or Identity admins to understand how the SPNs are behaving in the tenant.
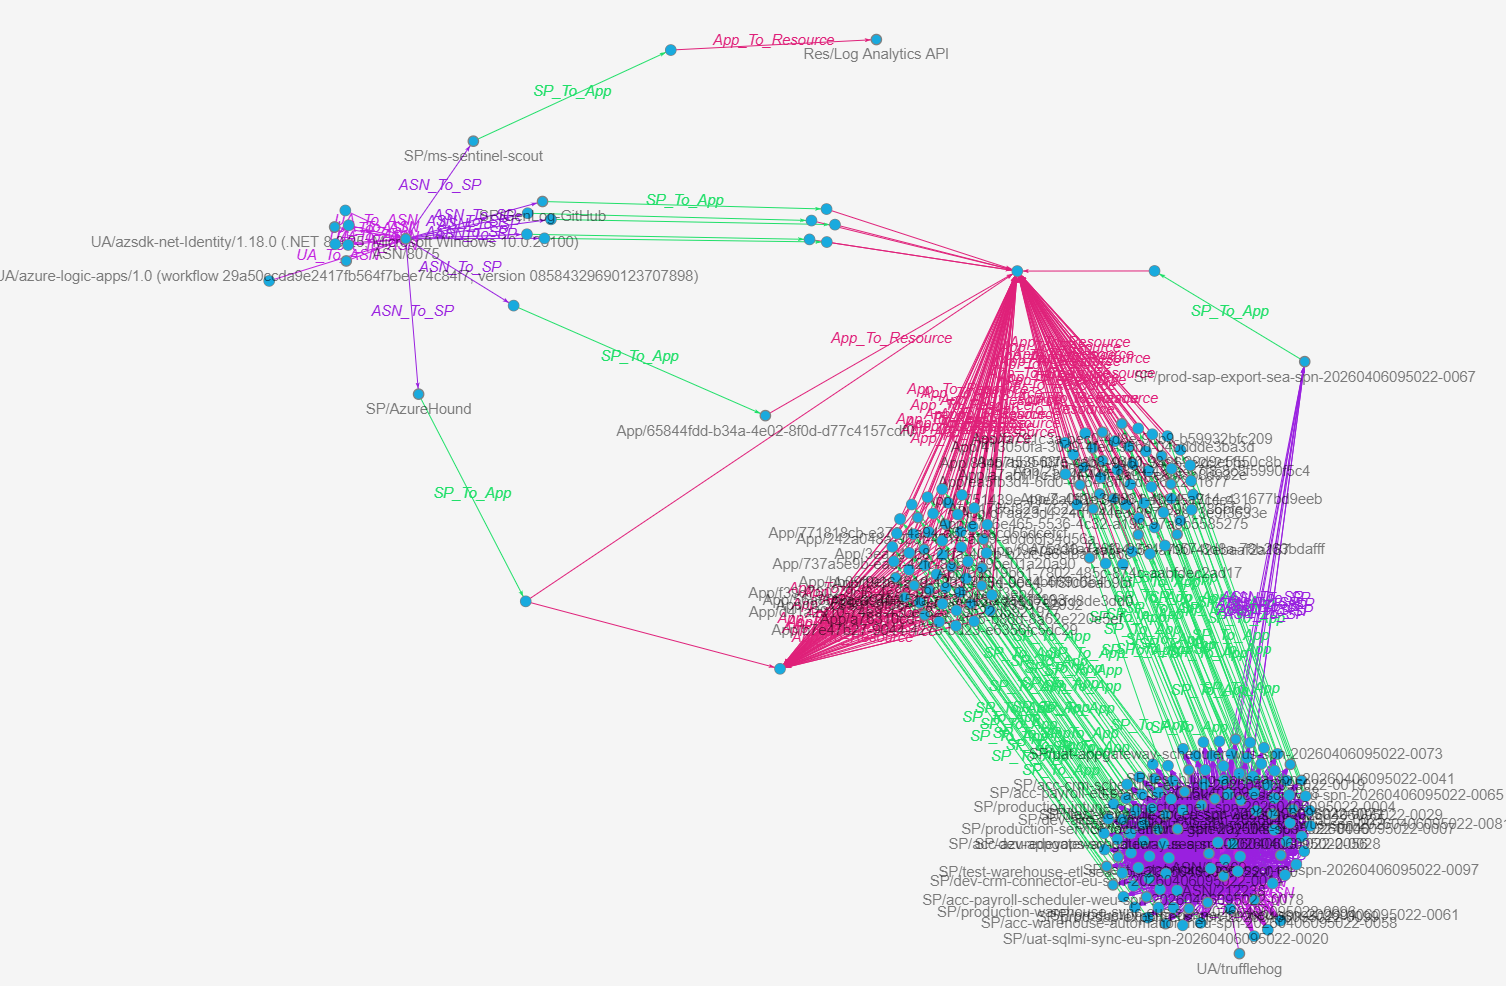
Graph UserAgent → ASN → Service Principal → AppId → ResourceDisplayName:
let logs = database('Demo').SPNs;
let sp_activities =
    SPNs
    | distinct
        ServicePrincipalId,
        ServicePrincipalName,
        ClientCredentialType,
        AutonomousSystemNumber,
        Location,
        IPAddress,
        AppId,
        ResourceDisplayName,
        UserAgent,
        ResultType;
let sp_mapping = todynamic(```
{
  "node_types": [
    {
      "type":    "UserAgent",
      "id":      "UA",
      "key":     "UserAgent",
      "props":   [ "UserAgent" ],
      "defaults": {},
      "defIcon": ""
    },
    {
      "type":    "ASN",
      "id":      "ASN",
      "key":     "AutonomousSystemNumber",
      "props":   [ "AutonomousSystemNumber", "Location", "IPAddress" ],
      "defaults": {},
      "defIcon": ""
    },
    {
      "type":    "ServicePrincipal",
      "id":      "SP",
      "key":     "ServicePrincipalName",
      "props":   [ "ServicePrincipalId", "ServicePrincipalName", "ResultType" ],
      "defaults": {},
      "defIcon": ""
    },
    {
      "type":    "App",
      "id":      "App",
      "key":     "AppId",
      "props":   [ "AppId", "ResourceDisplayName", "ResultType" ],
      "defaults": {},
      "defIcon": ""
    },
    {
      "type":    "Resource",
      "id":      "Res",
      "key":     "ResourceDisplayName",
      "props":   [ "ResourceDisplayName", "AppId", "ResultType" ],
      "defaults": {},
      "defIcon": ""
    }
  ],
  "edges": [
    {
      "type":   "UA_To_ASN",
      "source": { "id": "UA",  "type": "UserAgent" },
      "target": { "id": "ASN", "type": "ASN" },
      "props":  [ "IPAddress", "Location" ]
    },
    {
      "type":   "ASN_To_SP",
      "source": { "id": "ASN", "type": "ASN" },
      "target": { "id": "SP",  "type": "ServicePrincipal" },
      "props":  [ "ResultType" ]
    },
    {
      "type":   "SP_To_App",
      "source": { "id": "SP",  "type": "ServicePrincipal" },
      "target": { "id": "App", "type": "App" },
      "props":  [ "ResultType" ]
    },
    {
      "type":   "App_To_Resource",
      "source": { "id": "App", "type": "App" },
      "target": { "id": "Res", "type": "Resource" },
      "props":  [ "ResultType" ]
    }
  ]
}
```);
sp_activities
| invoke Lift_To_Graph(sp_mapping)
| invoke Graph_Render_View()
Overall, the SPN based graphs provide results for different scenarios, such as:
- Spot SPNs suddenly coming from new ASNs/locations (possible key leakage or abuse).
- See which UserAgents + ASNs are shared across many SPNs (shared automation).
- Highlight high‑value resources (AppId/ResourceDisplayName) accessed via weak credential types (e.g., client secrets from risky ASNs).
Conclusion
The new Kusto graph functions make it significantly easier to move from tables to graphs without adding the need to write tens of additional lines of KQL. Instead of writing make-graph logic, you define a simple mapping and let the Lift_To_Graph() and Graph_Render_View() functions do the work. This lowers the bar to use graph-based analysis in detection, response and hunting scenarios and opens the door to new ways of understanding security data.
A few key takeaways:
- Start with a small and known dataset before scaling to big volumes of logs.
- Think in relationships, not in tables.
- Iterate your graph mappings and filter into interesting nodes for deeper analysis.
- Combine graph views with existing hunting and detection workflows to build context faster.
- You do not have to start building a data pipeline to forward logs to Azure Data Explorer, simple exports are good enough to get you started.
Graphs are an enhancement of the current Kusto support as they introduce new perspectives to analyze the data. The real value comes when you start exploring with your own data (or KC7 data): start small, map relationships that matter to your environment, and gradually expand your graph models. 📊
Questions? Feel free to reach out to me on any of my socials.