[DxBP] Part 1 - Technical Detection Engineering Best Practices
Detection engineering is far more than just writing a couple of rules and you are done, it is about building resilient, high quality detections that detect evolving threats. This blog series covers both the technical and process related best practises of detection engineering. These best practices help you to build better custom detections or analytics rules and optimizes the process in which these detections are deployed and analysed. This blog series starts with three parts and will be expanded over time as additional detection best practice blogs are added.
While the examples in this blog focus on KQL based examples, the underlying principles are not KQL-specific. The detection engineering challenges discussed in the series can be adapted to any other platform/language.
The series kicks off with the technical quirks of writing detections. Technical best practices cover the things that one should keep an eye on when creating the queries to detect or not miss 😉 malicious behaviour.

Understanding Ingestion Delays
Before we can write detections, we need to get the data, the transit of the log data takes time. The delay in log delivery is the ingestion delay. Before you start drafting any new rules, the ingestion delay for the involved log sources should be considered. How long you find acceptable for these logs to arrive depends on your risk appetite, in which you need to answer the question: what is the risk appetite that you accept? Is coverage of 90% of the logs sufficient, or do you want to acieve 95% coverage?
It takes some time for the logs to be shipped from the source (Workstation, Server, SaaS Application, Third Party Cloud, etc) to the event collector and into your tenant. The function ingestion_time() is used to extract the ingestion time of each row. This function can be used to calculate the ingestion delay. With the query below, you can calculate the ingestion percentiles and average delay for each Sentinel and XDR table.
Calculate Ingestion Delay:
union withsource=TableName DeviceNetworkEvents, DeviceProcessEvents, DeviceLogonEvents, DeviceEvents,
IdentityQueryEvents, CloudAppEvents, AuditLogs, SigninLogs, EmailEvents, GraphAPIAuditEvents
| extend IngestionTime = ingestion_time()
| extend IngestionDelay = datetime_diff('minute', IngestionTime, TimeGenerated)
| summarize TotalEvents = count(), Average = round(avg(IngestionDelay), 1),
percentiles(IngestionDelay, 50, 75, 90, 95, 97, 99) by TableName
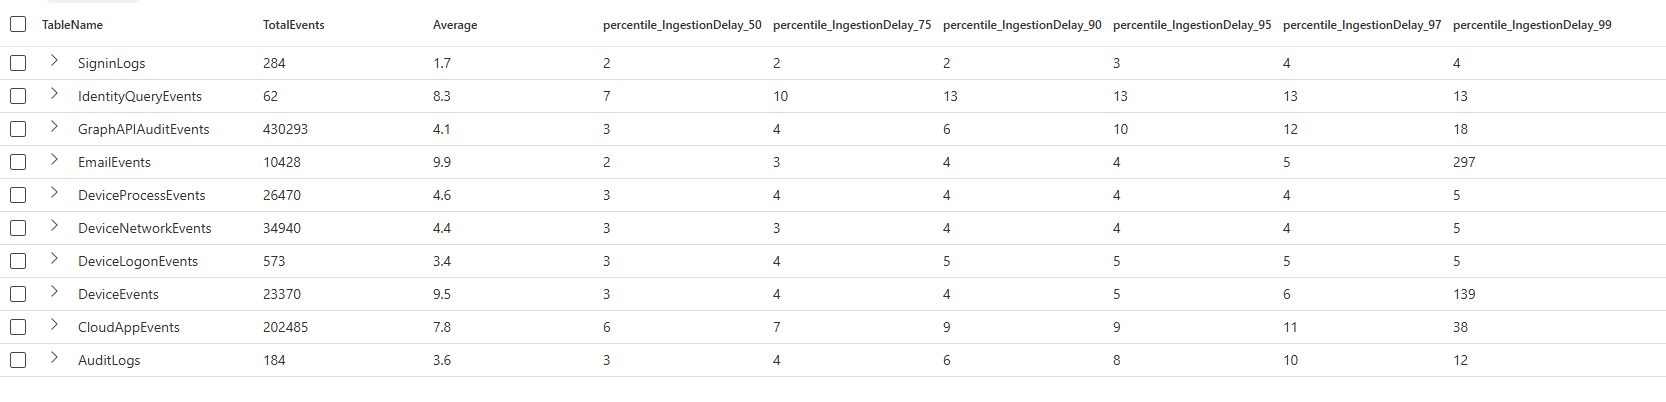
| sort by TableNameRunning the query in a test tenant returns the results shown in the image below. The average delay is not the most useful metric to analyze ingestion delays, as it can produce skewed results. Log ingestion is not distributed evenly, events may be buffered locally on devices (for example, when a device is powered off and later comes back online). When this happens, large bursts of delayed events influence the calculation, causing the average to be heavily affected by minimum and maximum values.
Percentiles provide a more meaningful metric in this context. They make the distribution explicit by answering questions such as “How long did 90% or 95% of events take to arrive?” This aligns much better with detection engineering needs. Meaning that percentile based summarization shows what percentage of events arrive within a given timeframe, as example below the 50% of the DeviceEvents logs arrives within 3 minutes, and 97% within 6 minutes.
There are a couple of things you can do to make sure logs are not ‘missed’ due to delays:
- Deploy detections with NRT frequency. This does not use a search window, removing the risk of ingestion delays.
- Increase the search window for detections to have broader coverage, the downside is that you may need to build deduplication logic to prevent duplicate alerts.
- Accept the risk, especially for workstation detections, it is expected that the last percent has significant ingestion delays. There is a clear reason why these logs arrive later; your colleages shut down their laptop on friday afternoon, which buffers the logs locally, on monday the logs are forwarded again, resulting in the delay. A periodic threat hunting query could be better at catching such outliers.
Handling Language Differences in Log Sources
The second best practice relates to the configuration of the language on the systems that send logs to you. In a fairytale world, we would have only one language across the entire device fleet, often that is not the case as you manage tenants of customers from different countries, legacy systems with different languages are used, or your company acquired companies abroad, resulting in different system lanaguage being used.
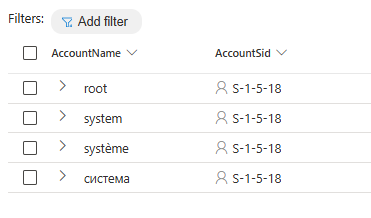
Those different languages will introduce problems, filtering on where AccountName != “system” will not be sufficient anymore, as seen in the example below. Therefore, it is important to use the security identifiers (SID) over the account names, the SID stays the same regardless of the language.
Discover different system users:
DeviceProcessEvents
| where AccountSid == "S-1-5-18"
| distinct AccountName, AccountSid
Use Unique Identifiers Over Names
The previous best practice is one of the examples of why unique identifiers are preferred over names. There are more reasons why you want to use those unique identifiers:
- Identifiers are unique, names are not.
- Names are more pround to false positives, especially when working with string filters, such ashas/contains.
- Different language representation for names (as discussed before).
Case Sensitivity in Logs
Because logs are not standarized it is recommended to always use =~, in~ or !~. This makes sure that the filtering is case insensitive, preventing you from missing data because of case sensitive filters. Yes, Microsoft recommends to use case sensitive filters to improve performance, but as long as the data is not structered I highly advise against it.
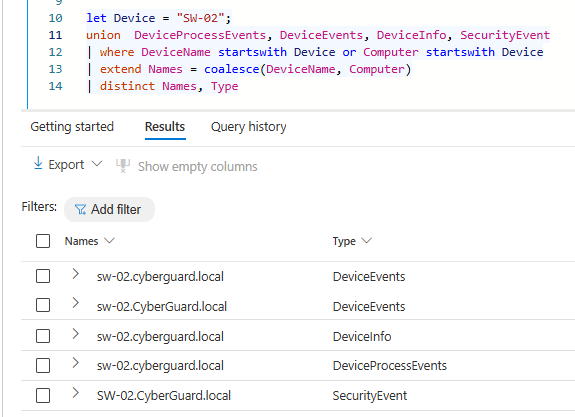
Let’s take a look at an example of why case sensitvity matters by looking at how hostnames are logged in Defender For Endpoint and Windows Security Event telemetry. In the example below we list all the different names for the host SW-02, as you can see it can even be different within the same table, as seen in the DeviceEvents.
let Device = "HostName";
union  DeviceProcessEvents, SecurityEvent
| where DeviceName startswith Device or Computer startswith Device
| extend Names = coalesce(DeviceName, Computer)
| distinct Names
Using Joins Correctly
Combining logs from different tables is very powerful, data can be combined using the join operator. This operator has a couple of quircks you need to know, if not used correctly your detections can easily overlook some data.
By default, the innerunique join type is used, which results in only unique matches on the join condition are returned. For security purposes, the innerunique serves limited value, as we want to return all matched events to analyse the full incident. Therefore, it is important to always use join kind = xyz, in which xyz is one of the join kinds. Even if you want to use the default join type, it is recommended to use join kind=innerunique to clearly state its a delibarte decision to use the innerunique kind.
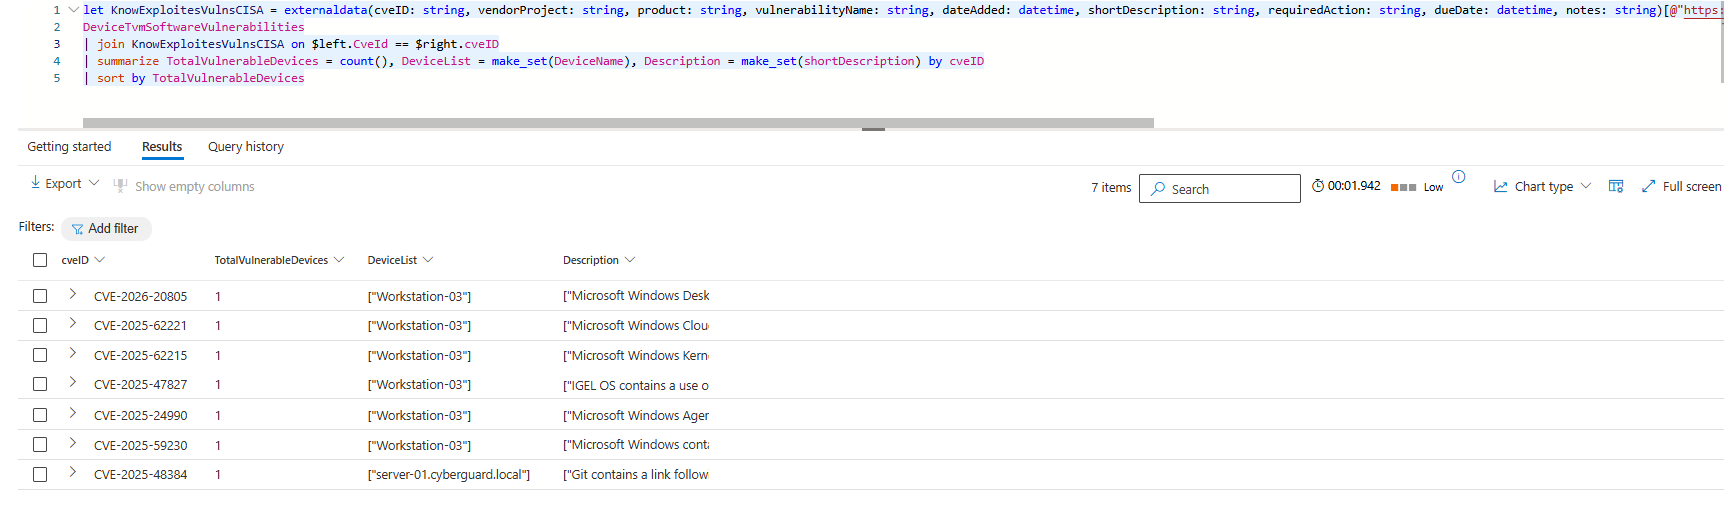
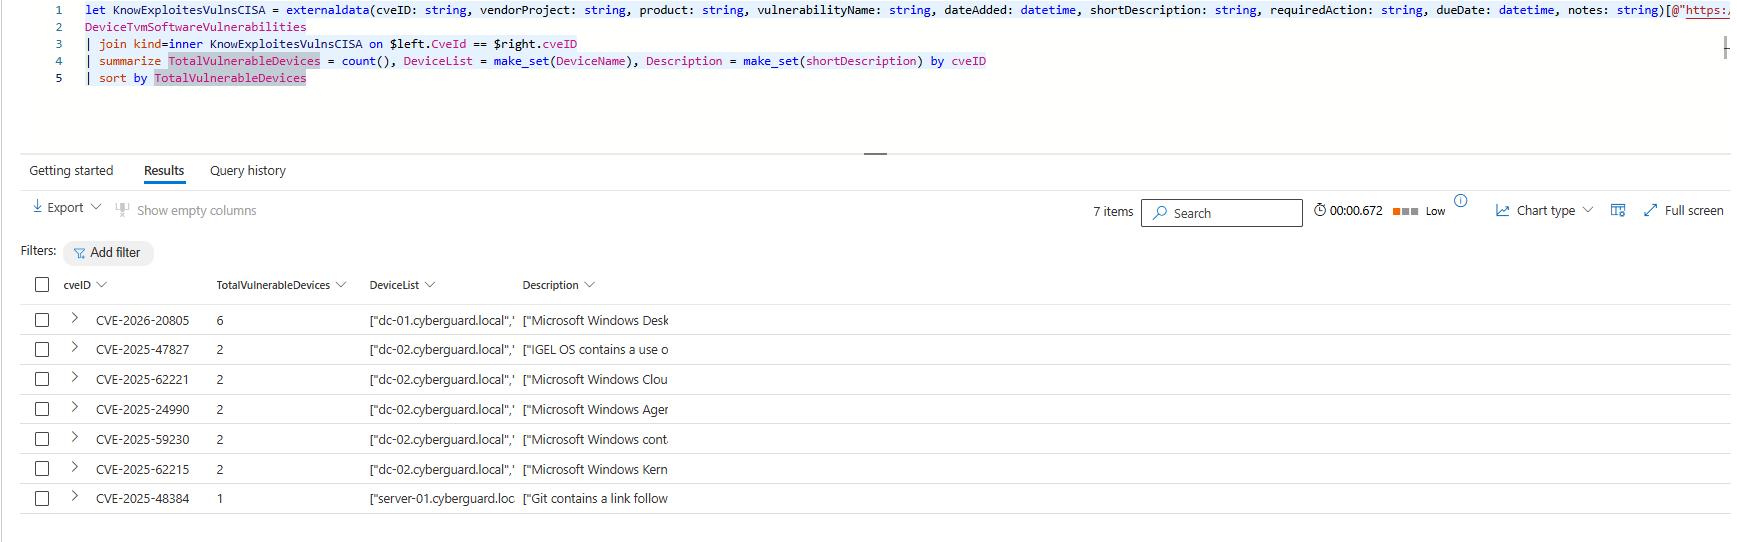
The example below uses the CISA Known Exploited Vulnerabilities Catalog to identify how many devices are vulnerable for each listed vulnerability. Based on the output, there does not seem to be a big issue in this environment, all vulnerabilities seem to be active on only one device. The catch here is that the query output is wrong because the join is using the innerunique kind meaning that only one unique match on the left and right side is returned. In reality you would have a CISO asking questions, as there are way more devices vulnerable. Adding a correct join type would have prevented the incorrect display of the output.
let KnowExploitesVulnsCISA = externaldata(cveID: string, vendorProject: string, product: string, vulnerabilityName: string, dateAdded: datetime, shortDescription: string, requiredAction: string, dueDate: datetime, notes: string)[@"https://www.cisa.gov/sites/default/files/csv/known_exploited_vulnerabilities.csv"] with (format="csv", ignoreFirstRecord=True);
DeviceTvmSoftwareVulnerabilities
| join KnowExploitesVulnsCISA on $left.CveId == $right.cveID
| summarize TotalVulnerableDevices = count(), DeviceList = make_set(DeviceName), Description = make_set(shortDescription) by cveID
| sort by TotalVulnerableDevices
When adding join kind=inner the results of the query completly change, now we see that the correct number of impacted device is listed. This example, it shows the importance of being aware that the join kind can have massive consequences for the output of your queries and can create blind spots or overlook malicious actions if not used correctly.
let KnowExploitesVulnsCISA = externaldata(cveID: string, vendorProject: string, product: string, vulnerabilityName: string, dateAdded: datetime, shortDescription: string, requiredAction: string, dueDate: datetime, notes: string)[@"https://www.cisa.gov/sites/default/files/csv/known_exploited_vulnerabilities.csv"] with (format="csv", ignoreFirstRecord=True);
DeviceTvmSoftwareVulnerabilities
| join KnowExploitesVulnsCISA on $left.CveId == $right.cveID
| summarize TotalVulnerableDevices = count(), DeviceList = make_set(DeviceName), Description = make_set(shortDescription) by cveID
| sort by TotalVulnerableDevices
Interested in more Vulnerability Management queries? The GitHub repository lists over 35 queries that can help you with vulnerability management and prioritization.
Did someone already tell you that joins are case sensitive? If not now you know the next quirk of joins :). The match on the left and right side is an equals statement, thus the values must have the same capitalization or your join does not identify a match. You can solve this by parsing the columns on which you join tolower or toupper.
Last but not least, we can solve the never ending discussion if size matters, in the context of joins size does matter. If you join two (or more) tables together, limit the required rows and columns on the left and right side by only projecting the important columns you need and using summarize arg_max(). This limits the total size of the join, meaning that either you can join more rows or your join runs faster.
FileName vs OriginalFileName
Attackers can rename system executables to evade detection T1036.003, this potential evasion should be part of the thought process when developing a detection. Only using the FileName column is not sufficient as the image below describes, if a detection only focussed on where FileName =~ ‘cmd.exe’ the hello.exe would not have been detected. The query can be easily changed to overcome such eveasion techniques, for this is to monitor both the FileName and ProcessVersionInfoOriginalFileName columns. The same goes for other variants in which a filename is used, such as the InitiatingProcessFileName and InitiatingProcessVersionInfoOriginalFileName😉.
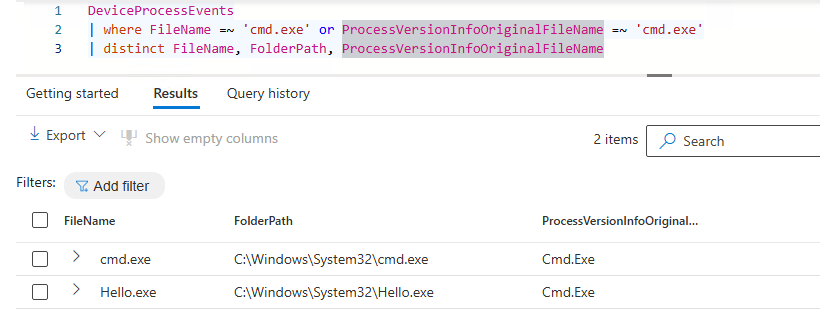
DeviceProcessEvents
| where FileName =~ 'cmd.exe' or ProcessVersionInfoOriginalFileName =~ 'cmd.exe'
| distinct FileName, ProcessVersionInfoOriginalFileName
Build Detections with Strong Entities
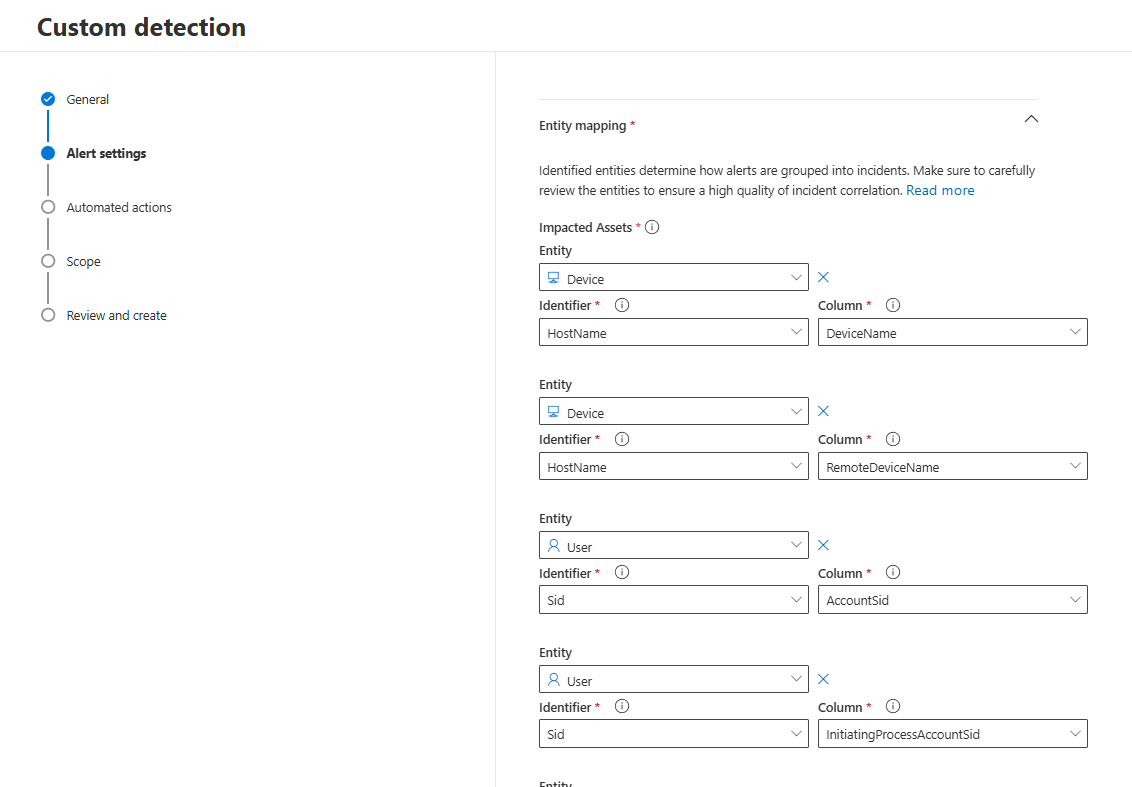
Detections are often the starting point of a larger chain of events. Once a detection triggered, automation typically enriches the incident, and at a later stage, an analyst becomes involved. The full flow of such alerts must be considered when developing detections. As a detection engineer, it is therefore not sufficient to only identify suspicious behaviour. It is becomes critical to ensure that the right entities are returned in the detection results. The Entity Mapping must always be reviewed to determine if the right entities are added and if more strong indidcators exists in the returned columns.
The more strong entities are configured in a detection, the easier it becomes to automate follow-up actions, such as:
- Automatic enrichment queries
- Automatic isolation/response
- Trend analysis
Conclusion
When writing detections, there are a lot of Kusto specifics you need to take into account. If the points mentioned in this blog are not considered, you may create blind spots in your detections or overwhelm your SOC with too many alerts.
Stay tuned for the second part of this series.
Questions? Feel free to reach out to me on any of my socials.